Next, students used Scale City videos and interactive tools to learn more about how scale and proportion are used in real life tourist attractions in Kentucky. From scaling two dimensional murals to scaling recipes at the World Chicken Festival, this site provided engaging content and cross-curricular connections. |
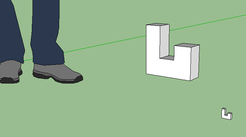
Students in 7th grade math used technology throughout the unit on scale and proportion. The unit began with a discussion about how people use scale in every day life. We discussed how movie makers use scale models, engineers and architects use scale to create construction drawings, and toymakers use scale to make adult sized objects just right for children. For the first activity, students measured simple geometric objects and created them in Sketchup at their original size and then smaller or larger based on a random scale factor. Students shared their Sketchup drawing in a shared Google folder, and then downloaded one of their peer's drawings to determine their scale factor. 
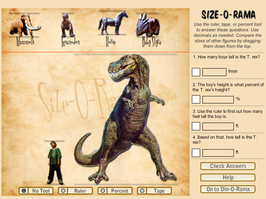
For the final project for the scale and proportion unit, students chose to create a scaled version of famous landmarks, everyday objects or areas of school. Working in teams, students could choose to create a scale model, diorama or 3-D drawing of their object. Some of the students who chose to create their object in Sketchup or Tinkercad will have their object printed on the high school 3-D printer. Scale and proportion are a big part of our everyday lives in many ways. This unit provided hands-on and tech-on opportunities for students make connections and apply proportional thinking.
1 Comment
advertisements reflecting the reality. In the end, students in this service learning invite you to consider that "every living thing should be treated with respect and love." Follow their learning on Twitter @4AnimalsASFG!
Grade 5 students are using some great technology tools to expand their understanding of the world. Using an interactive Zaption video, students learned more about confronting the population problems in India. Unlike lectures, video allows students to back up or rewind if they do not understand a concept. Zaption allows teachers to embed questions and critical thinking as students watch. Students can even create their own Zaptions. In addition to studying population problems, students are learning about the world's major rivers. These important waters are impacted by over-population and poor sanitation in many parts of the world. Students used an interactive map to help them study the locations of the world's biggest rivers.
Students used a graphic organizer in a Google Doc to organize and revise their ideas. Then they used Keynote to create slides for a presentation. During their presentation, a classmate filmed them using PhotoBooth. After the presentation, the student who filmed,cAirDropped the video file to their classmate while the rest of the students emailed the presenter with their feedback on one thing they thought he/she did well and one thing he/she needs to do to improve. At the same time, the teacher shared and filled in a rubric on Google Docs with feedback and their grade.
The student who presented then went into the hallway to watch the video, read the emails from classmates and read the teacher’s feedback on the rubric. All students will write a reflection about what aspects of their presentation they were proud of, and they will set goals for what aspects they would like to improve for their next presentation. The reflection, as well as the video of their presentation will be posted in their Language Arts website portfolio, which students’ parents will be able to view. |
Categories
All
|